Home Care Agency Profit Margin: How to Find Your Real Margin by Client and Payer
Christian Soriaga, CPA9 min read
On this page
Quick answer: Your home care agency profit margin is what is left of each payer's revenue after you pay caregivers and office costs. To find it, build a monthly report that splits revenue, hours and caregiver cost by payer and by client. Often one payer looks busy and earns very little.
In 2026 employers pay 7.65% FICA plus 0.6% net FUTA on the first $7,000 per employee (IRS Publication 15). Travel between job sites counts as hours worked (29 CFR 785.38).
If your calendar is full but your bank balance is thin, your home care agency profit margin is probably uneven across payers. This post shows how to find it by payer and by client. It also shows where margin leaks and what to ask your accountant to send each month. It is general information, not advice for your agency.
Key takeaways
- No official source publishes a typical home care agency profit margin. We do not quote one. Compute your own, by payer.
- Gross margin is revenue minus caregiver cost. Net margin is what remains after office and other overhead.
- Margin per hour equals bill rate minus loaded caregiver cost. Loaded cost includes employer FICA of 7.65%, FUTA of 0.6% on the first $7,000, state unemployment and workers' comp (IRS Publication 15).
- Paid hours you cannot bill are the biggest leak. Travel between clients is hours worked under 29 CFR 785.38.
- Cash lags profit. Weekly payroll plus slow payers can drain your account while the income statement looks fine.
- Medicaid, long-term care insurance, private pay and VA clients each need their own line. One blended margin hides the weak payer.
- Your monthly report should fit on one page, with margin by payer and an A/R aging.
Want to see your margin by payer? Bring last month's payroll and billing reports. Book a free 20-minute call.
What is gross margin vs. net margin for a home care agency?
Gross margin is what you keep after paying for the care itself. For a private-duty agency, that means revenue minus caregiver wages, employer payroll taxes and workers' comp. Net margin is what you keep after you also pay for the office: admin pay, rent, software, insurance, marketing and interest.
Here is a plain example. You bill $10,000 and caregiver cost is $7,000. Gross margin is $3,000, or 30%. Office costs are $2,200, so net margin is $800, or 8%. Illustrative numbers.
Gross margin tells you whether a payer or client is worth serving. Net margin tells you whether the whole agency is working. You need both, by month.
Action: Ask your bookkeeper to put caregiver cost in its own section of the income statement, apart from office pay.
What do typical margins look like?
We do not know, and neither does anyone else with an official source. The government does not publish a profit margin for private-duty home care agencies. Numbers you see in surveys or sales pages come from small samples, mixed payers and different cost definitions.
So we do not quote one here. A "typical" margin also does not pay your bills. Your own numbers do. Your state, wages, payer mix and fixed costs all change what a healthy margin looks like.
Use this post to compute your margin from your own books. Then watch whether it moves up or down month to month.
Action: Write down your gross margin for the last three months before you compare yourself to anyone.
How do I calculate margin per billable hour?
Margin per hour is your bill rate minus the full cost of one caregiver hour. The full cost is more than the wage on the paycheck. Add:
- Employer Social Security and Medicare at 7.65% of wages (IRS Publication 15, 2026).
- Federal unemployment tax (FUTA). The rate is 6.0% on the first $7,000 per employee, and 0.6% after the maximum state credit (IRS, Topic no. 759).
- State unemployment tax, which varies by state and by your own history.
- Workers' comp, which varies by state and class code.
- Paid time off and benefits, if you offer them.
Our post on caregiver payroll walks through this build-up with an $18.00 wage. In that illustrative table, the loaded cost is $20.49 per straight-time hour. This post uses that figure.
Take a $34.00 private-pay bill rate. Margin is $34.00 minus $20.49, or $13.51 per hour on paper. The words "on paper" matter. The next section shows why.
You can also run the numbers in our free home care rate calculator.
Action: Calculate the loaded cost for your most common wage and write it at the top of your payer report.
Where does home care margin leak?
Four places show up again and again in the books we see.
1. Paid hours you never bill. The federal rule says travel from job site to job site during the workday counts as hours worked (29 CFR 785.38). You pay for that drive. Most clients' bill rates do not cover it. Say a caregiver has 38 client hours and 3 travel hours. You pay for 41 hours and bill 38. The 3 travel hours cost about $61 at $20.49 loaded. Illustrative.
2. Overtime. The 2013 federal rule requires time and a half after 40 hours for third-party agencies. DOL has paused its own enforcement while it works on a final rule, but the regulation is unchanged. We cover the status in caregiver payroll. In the illustrative build-up there, an overtime hour costs $30.70 loaded instead of $20.49. That is $10.21 more per hour.
3. Cancelled visits. A client cancels the morning of a visit. You pay a minimum, or the caregiver already drove over. Either way you carry cost with no revenue. Suppose you pay a 2-hour minimum on 15 late cancellations in a month. That is 30 hours at $20.49, or $614.70. Illustrative.
4. Slow payers. Margin is not cash. You pay caregivers every week. If a payer takes 60 days, you finance two months of its payroll. An A/R aging report, which groups unpaid invoices by how old they are, shows who is holding your money.
Action: Pull last month's paid hours and billed hours by caregiver. The gap is your leak.
How does margin differ by payer?
Different payers pay different rates, pay on different schedules and come with different rules. Keep each on its own line.
- Private pay. You set the rate. Margin is usually highest here, but you also carry the sales cost.
- Long-term care insurance. The policy and your contract set the rate. Claims paperwork can slow payment.
- Medicaid waiver. The state or program sets the rate. Under the Medicaid 80/20 rule, at least 80% of those payments must reach direct care workers as pay and benefits once the 2030 threshold applies. That leaves 20% for everything else. See the Medicaid 80/20 rule in 2026.
- VA. Authorizations set the hours and the rate. Track these clients on their own line.
The worked example below uses three payers. Treat every number as made up.
Illustrative one-month report (loaded caregiver cost of $20.49 per paid hour):
| Private pay | Long-term care insurance | Medicaid waiver | Total | |
|---|---|---|---|---|
| Billed hours | 1,000 | 400 | 1,200 | 2,600 |
| Bill rate per hour | $34.00 | $32.00 | $27.50 | |
| Revenue | $34,000.00 | $12,800.00 | $33,000.00 | $79,800.00 |
| Paid hours | 1,040 | 420 | 1,320 | 2,780 |
| Caregiver cost | $21,309.60 | $8,605.80 | $27,046.80 | $56,962.20 |
| Gross margin | $12,690.40 | $4,194.20 | $5,953.20 | $22,837.80 |
| Gross margin % | 37.3% | 32.8% | 18.0% | 28.6% |
| Gross margin per billed hour | $12.69 | $10.49 | $4.96 | $8.78 |
Look at the Medicaid column. The rate minus cost is $7.01 per hour on paper ($27.50 minus $20.49). After 120 paid hours that were never billed, the real figure is $4.96 per billed hour.
Now add office costs. Suppose they are $16,000 for the month (assumed). Net margin is $22,837.80 minus $16,000, or $6,837.80. That is 8.6% of revenue. Office cost per billed hour is $16,000 divided by 2,600, or $6.15.
The Medicaid line earns $4.96 per billed hour and does not cover its $6.15 share. Private pay and long-term care insurance carry it. Without that, the owner would feel busy and see little in the bank.
Action: Build this table for your last full month, even if you do it by hand.
What should my monthly margin report include?
Keep it to one or two pages. Ask for:
- Revenue, hours and bill rate by payer.
- Paid hours vs. billed hours, by payer and in total.
- Loaded caregiver cost by payer, with overtime hours called out.
- Gross margin in dollars, percent and per billed hour, by payer.
- Margin by client: your top 10 and bottom 10. A single client with long drives and cancellations can pull a payer down.
- Office costs and net margin.
- A/R aging by payer.
- A cash bridge: net income, plus or minus the change in A/R, and what that does to your bank balance.
Number 8 answers the question most owners ask: why is profit up but cash flat? Usually receivables grew. If your Medicaid billing slid by 30 days, a profitable month can still end with less cash.
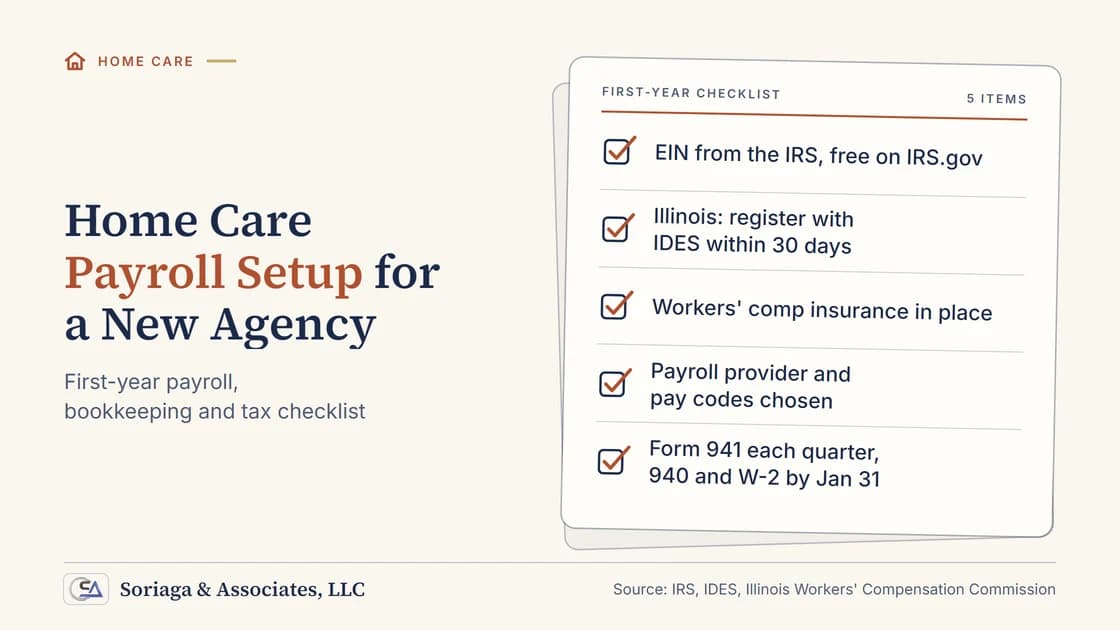
Your books must be set up to produce this. That means revenue split by payer, caregiver cost in its own accounts, and payroll matched to the same month. We cover that setup in home care payroll setup for a new agency. Clean monthly books come from bookkeeping services that code by payer, not just by bank line.
Action: Ask your bookkeeper whether your revenue is coded by payer today.
When should I raise my rates?
Raise rates when a payer's margin per hour stops covering its share of office costs, or when a cost input moves. In the example, office cost per billed hour is $6.15. Any payer with margin per hour below that is being supported by the others.
Check the trigger points:
- Wages rise. A $1.00 raise adds about $1.14 once you add the 7.65% FICA and the assumed state and workers' comp rates in our payroll post.
- Payroll tax or workers' comp rates change.
- Unbilled paid hours grow. Fix scheduling first. If it persists, price the travel into the rate.
- A payer's A/R slows. Slow cash has a financing cost.
For private pay, you decide. Use the home care rate calculator to find the bill rate for your target margin. For Medicaid, the program sets the rate. Your tools there are scheduling clients in the same area, cutting unbilled hours, and deciding how many hours of that payer to accept.
Action: List each payer's margin per hour next to your office cost per billed hour. Raise or reprice where the first is lower.
What we see in practice
The most common problem we fix in home care books is a blended margin. Revenue sits in one account, caregiver cost in another, and nobody can say which payer earns what. Owners feel the squeeze but cannot point to it.
The second is payroll that is right for the paycheck but not matched to the month. Margin then swings for reasons that have nothing to do with care.
A monthly review fixes both. Once revenue and caregiver cost are coded by payer, the report is fast to build. Our home care accounting services are built around this monthly reporting. For owners who want help acting on it, our fractional CFO services include a regular review of margin, cash and pricing. We quote both on a free call.
Not sure which payer is costing you? Send us last month's payroll and billing reports and book a free 20-minute call.
Frequently asked questions
What is a good home care agency profit margin?
No official source publishes one, so we do not quote a number. A margin that works for you is one that covers your office costs, pays you and builds a cash cushion. Work it out from your own books, by payer, each month.
How do I calculate my home care agency profit margin?
Start with revenue by payer. Subtract caregiver wages, employer payroll taxes and workers' comp for the same month to get gross margin. Subtract office and other overhead to get net margin. Divide each by revenue to get a percentage.
Why does my bank balance not match how busy we are?
Usually three things: caregivers are paid weekly while some payers pay in 30 to 60 days or more, paid hours that were never billed, and overtime or cancelled visits you still paid for. A monthly report with an A/R aging shows which one it is. If you want help reading it, book a free call.
Is travel time between clients paid?
Yes. The federal regulation says travel from job site to job site during the workday is hours worked (29 CFR 785.38). Normal travel from home to the first client is not. Those hours are paid cost that you usually cannot bill.
When should a home care agency raise its rates?
Raise private-pay rates when a payer's margin per hour no longer covers its share of office costs, or when wages, taxes or insurance rise. Medicaid rates are set by the program, so for those clients you fix unbilled hours, scheduling and caregiver mix instead.
Next step
Pick last month and build the one-page table above: revenue, billed hours, paid hours and caregiver cost by payer. If it takes more than an afternoon, your books are not set up to answer this question yet. That is fixable.
Book a free 20-minute call and we will look at how your revenue and payroll are coded, and what a monthly margin report would look like for your agency. See what monthly reporting includes on our home care accounting services page, or call (630) 491-1268.
Sources
- IRS, Publication 15 (2026), Employer's Tax Guide
- IRS, Topic no. 759, Form 940, Employer's Annual Federal Unemployment (FUTA) Tax Return
- eCFR, 29 CFR 785.38, Travel that is all in the day's work
- Soriaga & Associates, LLC: Caregiver payroll (overtime status and the illustrative loaded cost build-up)
Last updated: October 2026.
This article is general information, not legal or tax advice. The worked examples are illustrative.
Soriaga & Associates, LLC is a CPA firm founded in 1985 in Lisle, Illinois, serving home health, hospice, home care, wound care and dental providers nationwide. (630) 491-1268.