Hospice Cost Report Statistics (2026): 50+ Data Points on Medicare Margins, the Aggregate Cap, and CMS-1984 Filing
Christian Soriaga, CPAUpdated 7 min read
On this page
The aggregate FFS Medicare margin for hospices was 8.0% in 2023 — a figure MedPAC builds directly from the Medicare cost reports hospices file every year (MedPAC, Report to the Congress: Medicare Payment Policy, March 2026). Medicare spent $28.3 billion on hospice care for more than 1.8 million beneficiaries in 2024, paid across 6,706 hospices — a provider base growing almost entirely because for-profit operators keep entering the market. Profitability hinges on one number the cost report captures better than any other: length of stay. Hospices that keep patients longest earn the highest margins, push hardest against the $35,361.44 annual per-beneficiary cap, and draw the most scrutiny. The Hospice Medicare Cost Report (Form CMS-1984-14) is where all of it reconciles, and a late filing can convert a year of payments into a recoverable overpayment. We aggregated data from MedPAC, CMS, the Medicare Administrative Contractors, and other primary sources to build the definitive statistical picture of the hospice cost report and the payment system behind it.
Want these benchmarks applied to your hospice? Soriaga & Associates prepares hospice Medicare cost reports and cap calculations for a flat $1,599.99 (low- or full-utilization) or $500 (no-utilization). Book a free 20-minute call.
Key Takeaways
- The aggregate FFS Medicare margin for hospices was 8.0% in 2023, down from 9.8% in 2022 (MedPAC, March 2026).
- Medicare hospice spending reached $28.3 billion in 2024 for more than 1.8 million beneficiaries (MedPAC, March 2026).
- 6,706 hospices served Medicare beneficiaries in 2024, a 2.6% increase driven by for-profit entry (MedPAC, March 2026).
- The FY 2026 hospice aggregate cap is $35,361.44 per beneficiary (CMS, FY 2026 Final Rule).
- Cost reports (Form CMS-1984-14) are due 150 days (the last day of the fifth month) after the fiscal year-end (CMS PRM; MAC guidance).
- About 28% of hospices exceeded the cap in 2023, each by roughly $410,000 on average (MedPAC, March 2026).
- Average length of stay rose to 99.6 days in 2024; the median was just 19 days (MedPAC, March 2026).
- For-profit hospices grew about 5% in 2024 while nonprofit ownership declined (MedPAC, March 2026).
- The FY 2026 payment update is +2.6% (about +$750 million) (CMS, FY 2026 Final Rule).
- 1 in 10 hospices discharged 56% or more of their patients alive in 2023 (MedPAC, March 2026).
- Provider-based hospices ran a -25.6% margin in 2023, versus positive margins for freestanding hospices (MedPAC, March 2026).
- MedPAC recommends Congress eliminate the FY 2027 payment update (a rate freeze) (MedPAC, March 2026).
1. Filing the Hospice Cost Report (CMS-1984-14): Deadlines and Compliance
The hospice cost report is the annual reconciliation that supports Medicare settlement and feeds the national data used to set future rates. Like the home health cost report, its deadline is unforgiving.
Filing deadlines and penalties
Every Medicare-participating hospice must file an annual cost report under 42 CFR 413.20. Freestanding hospices use Form CMS-1984-14, required for cost reporting periods beginning on or after October 1, 2014 (CMS). The filing window and late-filing consequences track the standard Provider Reimbursement Manual rules.
| Metric | Value | Source |
|---|---|---|
| Cost report form (freestanding hospice) | CMS-1984-14 | CMS |
| Cost report due date after fiscal year-end | 150 days (last day of 5th month) | CMS PRM; MAC guidance |
| Penalty for late/missing filing | Interim payments may be deemed overpayments | 42 CFR 413.20; CMS PRM Part I §2413 |
| Low-utilization filing threshold | $200,000 total Medicare reimbursement | CMS PRM 15-2 §110 |
| Chain organizations | Each hospice files a separate report | 42 CFR 413.20(b) |
| Reopening window | 3 years from settlement date | CMS PRM; MAC guidance |
| Appeal deadline | 180 days from settlement date | CMS PRM; MAC guidance |
The cost report is more than a compliance formality for hospices because the program uses cost-per-day data from these filings to judge payment adequacy. Sloppy cost allocation doesn't just risk a rejected filing — it distorts the numbers regulators use to justify rate changes. A disciplined Medicare cost report filing process protects both the settlement and the integrity of an agency's reported cost per day.
2. Medicare Hospice Spending and Utilization
Hospice is one of the faster-growing parts of traditional Medicare, driven by rising election rates among decedents and longer stays.
Spending, beneficiaries, and use rates
| Metric | Value | Source |
|---|---|---|
| Medicare hospice spending, 2024 | $28.3 billion | MedPAC, March 2026 |
| Medicare beneficiaries receiving hospice, 2024 | More than 1.8 million | MedPAC, March 2026 |
| Share of decedents electing hospice, 2023 | 51.7% (a new high in 2024) | MedPAC, March 2026 |
| Average length of stay, 2024 | 99.6 days (up ~3 days) | MedPAC, March 2026 |
| Median length of stay, 2024 | 19 days (up 1 day) | MedPAC, March 2026 |
| Beneficiaries with length of stay over 180 days, 2024 | 17.5% | MedPAC, March 2026 |
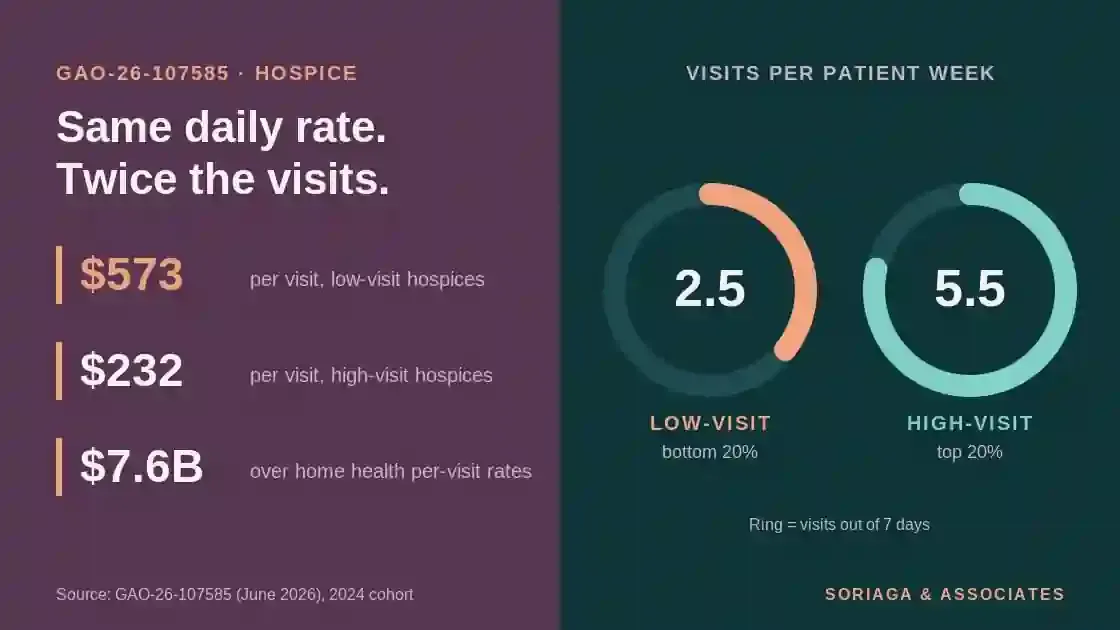
| Average routine home care visits per week, 2024 | 3.9 | MedPAC, March 2026 |
The gap between the 19-day median and the 99.6-day average stay is the single most important dynamic in hospice economics: a minority of very long stays pulls the average far above the typical patient, and those long stays are where both profit and cap risk concentrate.
3. Hospice Provider Supply, Ownership, and For-Profit Growth
The number of hospices filing cost reports keeps rising, but the growth is lopsided toward for-profit entrants — a pattern regulators increasingly treat as a program-integrity signal.
| Metric | Value | Source |
|---|---|---|
| Hospices serving Medicare beneficiaries, 2024 | 6,706 | MedPAC, March 2026 |
| Year-over-year provider growth, 2024 | +2.6% | MedPAC, March 2026 |
| For-profit hospice growth, 2024 | ~+5% | MedPAC, March 2026 |
| Nonprofit ownership trend | Declining for several years | MedPAC, March 2026 |
| Freestanding share of hospices, 2024 | ~88% | MedPAC, March 2026 |
| Urban share of hospices, 2024 | ~88% | MedPAC, March 2026 |
For-profit entry has been the entire growth story in hospice supply for years, mirroring the concerns MedPAC has raised about aberrant provider growth in states such as California. Nonprofit and rural hospices, by contrast, are flat or shrinking.
4. What Cost Reports Reveal About Hospice Margins and Profitability
MedPAC's hospice margin analysis is built directly from Medicare hospice cost report files — which is why the accuracy of cost-per-day reporting matters well beyond a single agency's settlement.
The aggregate margin and cost per day
| Metric | Value | Source |
|---|---|---|
| Aggregate FFS Medicare margin, 2023 | 8.0% | MedPAC, March 2026 |
| Aggregate FFS Medicare margin, 2022 | 9.8% | MedPAC, March 2026 |
| Projected aggregate FFS Medicare margin, 2026 | ~9% | MedPAC, March 2026 |
| Average hospice cost per day, 2024 | ~$168 | MedPAC, March 2026 |
| Cost-per-day growth, 2024 | +1.1% | MedPAC, March 2026 |
| Cost per day, urban vs. rural, 2024 | $170 vs. $156 | MedPAC, March 2026 |
Margin variation by hospice type
Margins swing enormously by ownership, setting, and patient mix — and the cost report is what exposes the spread.
| Metric (2023 aggregate FFS Medicare margin) | Value | Source |
|---|---|---|
| Below-cap hospices | 9.0% | MedPAC, March 2026 |
| Nonprofit hospices | 2.6% | MedPAC, March 2026 |
| Provider-based hospices | -25.6% | MedPAC, March 2026 |
| Urban hospices | 8.3% | MedPAC, March 2026 |
| Hospices with more nursing-facility / assisted-living patients | 13.3% | MedPAC, March 2026 |
| 75th-percentile hospice | ~21% | MedPAC, March 2026 |
Profitability is tied to length of stay: hospices with longer stays have lower cost per day and therefore higher margins. That is the economic engine behind the cap disputes in the next section — and why precise cost allocation and bookkeeping determines whether a hospice's reported margin is defensible.
5. The Aggregate Cap, Long Stays, and Live Discharges
The aggregate cap limits total per-beneficiary payments and is the central compliance risk in hospice. The cost report and the cap calculation together determine whether a hospice owes money back.
Cap exceedance and long-stay concentration
| Metric | Value | Source |
|---|---|---|
| FY 2026 aggregate cap per beneficiary | $35,361.44 | CMS, FY 2026 Final Rule |
| FY 2025 aggregate cap | $34,465.34 | CMS, FY 2026 Final Rule |
| FY 2027 proposed cap | $36,210.11 | CMS, FY 2027 Proposed Rule |
| Share of hospices exceeding the cap, 2023 | ~28% | MedPAC, March 2026 |
| Average cap overage per above-cap hospice, 2023 | ~$410,000 | MedPAC, March 2026 |
| California hospices exceeding the cap, 2023 | More than half | MedPAC, March 2026 |
Live discharges as a quality and integrity signal
| Metric | Value | Source |
|---|---|---|
| Hospices discharging 56%+ of patients alive, 2023 | Top 10% of providers | MedPAC, March 2026 |
| Above-cap hospice behavior | Longer stays + higher live-discharge rates | MedPAC, March 2026 |
| MedPAC recommendation (2020, reaffirmed) | Wage-adjust and cut the cap by 20% | MedPAC, March 2026 |
High live-discharge rates paired with long stays are the pattern MedPAC flags as potential program-integrity abuse: it suggests admitting patients who may not meet the six-month terminal-prognosis criterion. Any hospice near the cap should treat its cost report and cap calculation as a linked, year-round exercise, not a year-end surprise.
6. Payment Rates, Levels of Care, and the FY 2026-2027 Updates
Hospice is paid a per-diem across four levels of care, updated annually. FY 2026 brought a modest raise; MedPAC wants FY 2027 frozen.
FY 2026 payment update and rates
| Metric | Value | Source |
|---|---|---|
| FY 2026 payment update | +2.6% (~+$750 million) | CMS, FY 2026 Final Rule |
| Market basket / MFP components | 3.3% market basket − 0.7% productivity | CMS, FY 2026 Final Rule |
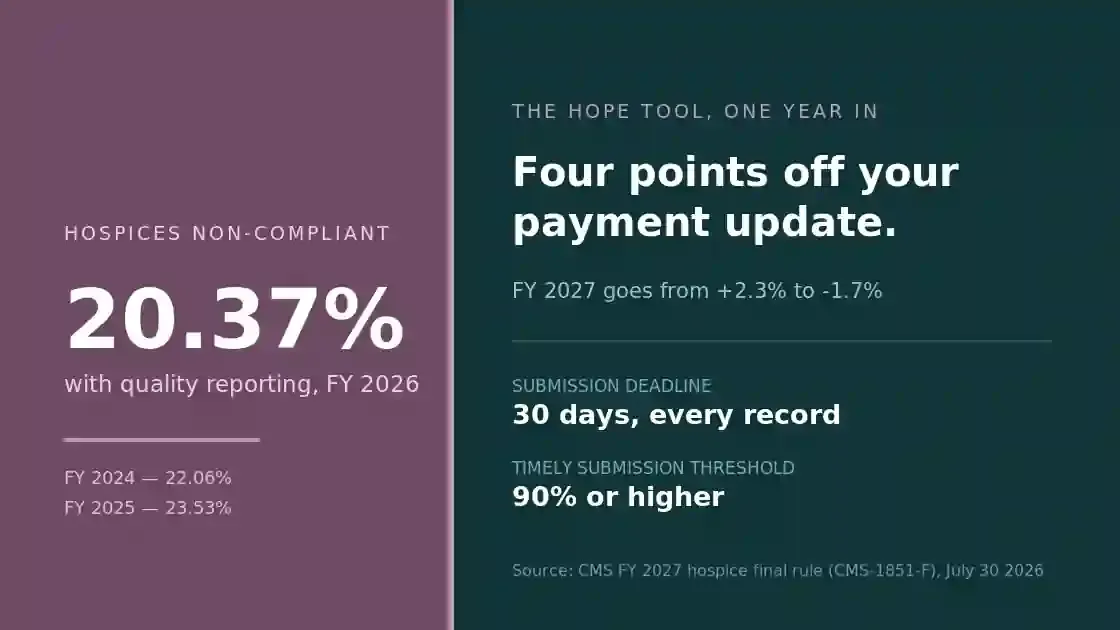
| Non-quality-reporting penalty | Net −1.4% (4-point reduction) | CMS, FY 2026 Final Rule |
| Routine home care, days 1-60 (FY 2026) | $230.83 per day | CMS, FY 2026 Final Rule (Federal Register) |
| Routine home care, days 61+ | Lower tiered per diem (~$182) | CMS, FY 2026 Final Rule |
| Levels of care | RHC, continuous home care, inpatient respite, general inpatient | CMS |
Labor shares and the FY 2027 outlook
| Metric | Value | Source |
|---|---|---|
| Labor share, routine home care | 66% | CMS |
| Labor share, continuous home care | 75.2% | CMS |
| Labor share, inpatient respite care | 61% | CMS |
| Labor share, general inpatient care | 63.5% | CMS |
| MedPAC FY 2027 recommendation | Eliminate the payment update (freeze) | MedPAC, March 2026 |
With margins projected near 9% for 2026 and payment adequacy indicators positive, MedPAC concluded current rates are sufficient and recommended no increase for 2027. For hospices, that means efficiency — and the cost report that documents it — carries more weight than the annual rate bump.
Methodology and Sources
This roundup prioritizes primary, government, and official data sources. Hospice margins, cost per day, length of stay, live-discharge rates, and cap statistics come from MedPAC's analysis of Medicare hospice cost report and claims files; payment rates, the aggregate cap, and labor shares come directly from CMS rulemaking; filing rules come from CMS regulations and the Medicare Administrative Contractors. Where a figure reflects the most recent available data (2023 margin data and 2024 utilization data published in early 2026), the year is noted inline. Margin figures for above-cap hospices exclude cap overpayments except where noted.
Sources used:
- Medicare Payment Advisory Commission (MedPAC), Report to the Congress: Medicare Payment Policy, Chapter 10: Hospice Services, March 2026
- Centers for Medicare & Medicaid Services (CMS), FY 2026 Hospice Wage Index and Payment Rate Update Final Rule, and MLN Matters MM14190
- CMS, FY 2027 Hospice Wage Index and Payment Rate Update Proposed Rule
- CMS, Hospice Facility Cost Report Form CMS-1984-14 and instructions
- CMS Provider Reimbursement Manual (PRM) Part I & 15-2, and 42 CFR 413.20
- Federal Register, FY 2026 Hospice Wage Index and Payment Rate Update (payment rate tables)
Last updated: July 2026. We update this page as new MedPAC reports, CMS rules, and hospice cost report data are released.
Soriaga & Associates, LLC is a CPA firm with 25+ years of specialized experience in hospice, home health, and home care accounting and Medicare cost report preparation. If you have questions about your hospice's cost report, cap position, or margins, schedule a free consultation.