Home Health Cost Report Statistics (2026): 55+ Data Points on Medicare Margins, PDGM Reimbursement, and CMS-1728-20 Filing
Christian Soriaga, CPAUpdated 10 min read
On this page
Freestanding home health agencies posted a 21.2% fee-for-service (FFS) Medicare margin in 2024 — the number pulled directly from the Medicare cost reports agencies file each year (MedPAC, Report to the Congress: Medicare Payment Policy, March 2026). That margin has topped 17% on average for more than two decades, even as Medicare spent $16.0 billion on home health for 2.7 million FFS beneficiaries in 2024 and paid over 12,000 certified agencies. Yet for the first time in years, the math is tightening: CMS finalized a net 1.3% ($220 million) payment reduction for 2026, and MedPAC is asking Congress to cut the base rate another 7% in 2027. The Medicare Home Health Agency Cost Report (Form CMS-1728-20) is where all of this gets reconciled — and a late or sloppy filing can turn a year of interim payments into a recoverable overpayment. We aggregated data from MedPAC, CMS, the Medicare Administrative Contractors, the Bureau of Labor Statistics, and other primary sources to build the definitive statistical picture of the home health cost report and the payment system it feeds.
Want these benchmarks applied to your agency? Soriaga & Associates prepares home health Medicare cost reports for a flat $1,599.99 (low- or full-utilization) or $500 (no-utilization). Book a free 20-minute call.
Key Takeaways
- The FFS Medicare margin for freestanding HHAs was 21.2% in 2024, up 1.4 points from 2023 (MedPAC, March 2026).
- Medicare FFS spent $16.0 billion on home health in 2024 for about 2.7 million beneficiaries (MedPAC, March 2026).
- 12,234 HHAs were certified to participate in Medicare in 2024 (MedPAC analysis of the CMS Provider of Services file, March 2026).
- Cost reports are due 150 days (the last day of the fifth month) after the fiscal year-end (CMS Provider Reimbursement Manual; Novitas Solutions).
- Failure to file a timely cost report allows all interim payments for the period to be deemed overpayments (42 CFR 413.20; CMS PRM Part I §2413).
- CMS finalized a net -1.3% ($220 million) change to home health payments for CY 2026 (CMS-1828-F Final Rule, November 2025).
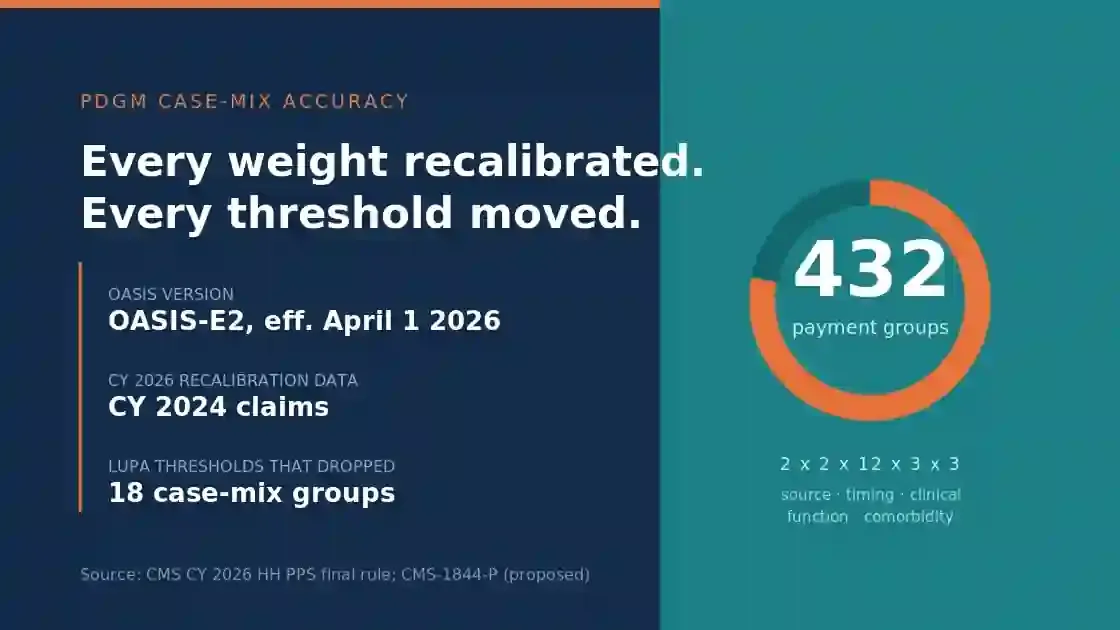
- The PDGM sorts every 30-day period into one of 432 payment groups (CMS-1828-F Final Rule, 2025).
- The low-utilization cost report threshold for HHAs is $200,000 in total Medicare reimbursement (CMS PRM 15-2 §110; Novitas Solutions).
- Hospital-based HHAs ran a -15.2% FFS Medicare margin in 2024, versus +21.2% for freestanding agencies (MedPAC, March 2026).
- In-person visits per full 30-day period fell to 8.4 in 2024, down 18% from 10.2 in 2019 (MedPAC, March 2026).
- Home health and personal care aide employment is projected to grow 17% from 2024 to 2034 (BLS, Occupational Outlook Handbook, 2025).
- MedPAC recommends Congress reduce the 2026 base payment rate by 7% for 2027 (MedPAC, March 2026).
1. Filing the Home Health Cost Report (CMS-1728-20): Deadlines and Compliance
The cost report is not optional paperwork — it is the annual reconciliation that determines whether an agency keeps, owes, or is owed Medicare money. Miss the deadline and the consequences are immediate and severe: the contractor can reclaim an entire year of interim payments.
Filing deadlines and penalties
Every Medicare-participating provider must file an annual cost report under 42 CFR 413.20(b). For home health agencies, the current form is CMS-1728-20, used for cost reporting periods beginning on or after January 1, 2020 (CMS). The filing window is tight, and the penalty for missing it is the harshest in the reimbursement rulebook.
| Metric | Value | Source |
|---|---|---|
| Cost report due date after fiscal year-end | 150 days (last day of 5th month) | CMS PRM; Novitas Solutions |
| Penalty for late/missing filing | All interim payments may be deemed overpayments | 42 CFR 413.20; CMS PRM Part I §2413 |
| Reminder letter sent before due date | At least 30 days prior | Novitas Solutions |
| Contractor accept/reject review window | Within 30 days of receipt | Novitas Solutions |
| Tentative settlement timeline | Within 90 days of acceptance | Novitas Solutions |
| Non-audited final settlement | Within 1 year of acceptance | Novitas Solutions |
| Window to request a reopening | 3 years from settlement date | Novitas Solutions |
| Deadline to file an appeal | 180 days from settlement date | Novitas Solutions |
Extensions are granted only for extraordinary circumstances outside the provider's control — a fire or flood, not a busy season — and even then require CMS approval (CMS PRM §413.24(f)). Accurate, well-supported filing is the difference between a routine settlement and a clawback; agencies that treat the cost report as a year-round accounting discipline rather than a five-month scramble avoid the rejection-and-resubmission cycle. (This is precisely the exposure a dedicated Medicare cost report filing process is built to eliminate.)
The low-utilization exception
Not every agency files a full report. Where Medicare utilization is low enough, the contractor can authorize an abbreviated filing.
| Metric | Value | Source |
|---|---|---|
| Low-utilization threshold, home health & most providers | $200,000 total Medicare reimbursement | CMS PRM 15-2 §110; Novitas Solutions |
| Low-utilization threshold, FQHCs / RHCs | $50,000 | Novitas Solutions |
| No-utilization filing | Signed statement + certification page within 150 days | CMS PRM 15-2 §110 |
| Chain organizations | Each provider files a separate report (no consolidated filing) | 42 CFR 413.20(b) |
Even under the low-utilization procedure, the contractor can still demand a full report and audit if it serves the program's interest — so the threshold is a filing convenience, not a compliance exemption.
2. Medicare Home Health Spending and Utilization
Home health is a large but slow-growing slice of Medicare. What the cost report captures at the agency level rolls up to a national spending line that has been essentially flat, while per-beneficiary payments have quietly climbed.
Spending and beneficiaries
Aggregate FFS spending held steady in 2024 after several years of decline, but that stability masks rising payment per user as enrollment shifts toward Medicare Advantage.
| Metric | Value | Source |
|---|---|---|
| FFS Medicare home health spending, 2024 | $16.0 billion | MedPAC, March 2026 |
| FFS beneficiaries receiving home health, 2024 | ~2.7 million | MedPAC, March 2026 |
| Total FFS home health payments, 2019 | $17.9 billion | MedPAC, March 2026 |
| Payment per FFS user of home health, 2023 | $5,839 | MedPAC, March 2026 |
| Average payment per full 30-day period, 2023 | $2,024 (+1.6% in 2024) | MedPAC, March 2026 |
| Medicare payment per in-person visit, 2023 | $237 (+3.3% in 2024) | MedPAC, March 2026 |
| Share of FFS beneficiaries using home health, 2023 | 7.9% | MedPAC, March 2026 |
For context, total Medicare spending reached $1,118.0 billion in 2024, growing 7.8% and representing 21% of national health expenditures (CMS, National Health Expenditure data). Home health, at $16.0 billion in FFS, is a small and shrinking share of that total.
Utilization and post-acute positioning
Fewer beneficiaries are using home health each year, but those who do receive roughly the same number of 30-day periods. Home health has also become the most common formal post-acute destination after a hospital stay.
| Metric | Value | Source |
|---|---|---|
| FFS home health 30-day periods, 2023 | 8.3 million | MedPAC, March 2026 |
| 30-day periods per 100 FFS beneficiaries, 2023 | 24.1 (+2.6% in 2024) | MedPAC, March 2026 |
| 30-day periods per home health user, 2024 | 3.1 | MedPAC, March 2026 |
| Share of hospital discharges to home health, first 10 months of 2024 | 18.0% | MedPAC, March 2026 |
| Same share, 2019 (pre-pandemic) | 15.8% | MedPAC, March 2026 |
| Full 30-day periods (vs. LUPA) share of volume, 2024 | ~93% | MedPAC, March 2026 |
| LUPA (low-utilization payment adjustment) share of periods, 2024 | ~7% | MedPAC, March 2026 |
The post-acute shift matters for cost reporting because case mix drives payment: home health overtook skilled nursing facilities as the top first post-acute site during the pandemic and remains 2.2 points above its 2019 discharge share.
3. Home Health Agency Supply, Ownership, and Consolidation
The number of agencies filing cost reports is growing — but almost entirely in one state. Beneath that headline, ownership is consolidating as large payers and platforms buy up freestanding agencies.
Agency counts and the California anomaly
| Metric | Value | Source |
|---|---|---|
| Certified Medicare HHAs, 2024 | 12,234 | MedPAC, March 2026 |
| Certified Medicare HHAs, 2019 | 11,356 | MedPAC, March 2026 |
| Net HHA growth, 2019–2024 | +870 agencies (~8%) | MedPAC, March 2026 |
| HHA count change excluding California, 2023–2024 | -1.0% | MedPAC, March 2026 |
| California HHA growth rate, 2019–2023 (annual avg) | +14.6% per year | MedPAC, March 2026 |
| Freestanding share of all HHAs, 2024 | ~95% | MedPAC, March 2026 |
| FFS beneficiaries in a ZIP served by 2+ HHAs, 2024 | 97% | MedPAC, March 2026 |
The national 1.5% increase in agencies in 2024 was driven almost entirely by Los Angeles County, which accounted for $1.4 billion — about 9% of total FFS home health spending — while representing only about 2% of FFS beneficiaries (MedPAC, March 2026). MedPAC and the California State Auditor have flagged the pattern as a potential program-integrity concern.
Consolidation and access to capital
The all-payer margin signals that agencies remain attractive to investors even as deal volume cools.
| Metric | Value | Source |
|---|---|---|
| All-payer margin, freestanding HHAs, 2024 | 5.0% | MedPAC, March 2026 |
| UnitedHealth (Optum) acquisition of Amedisys, completed | August 2025 | MedPAC, March 2026 |
| Pennant Group purchase of 54 agencies from UnitedHealth/Amedisys | $146.5 million (2025) | MedPAC, March 2026 |
| UnitedHealth acquisition of LHC Group, 2023 | $5.4 billion | MedPAC, March 2026 |
| Humana acquisition of Kindred at Home, 2021 | $8.1 billion | MedPAC, March 2026 |
4. What Cost Reports Reveal About Margins and Profitability
This is the section the cost report exists to produce. MedPAC's margin analysis is built directly from Medicare home health cost report files — which means the accuracy of every agency's filing feeds the national numbers that shape future payment policy.
The FFS Medicare margin over time
| Metric | Value | Source |
|---|---|---|
| FFS Medicare margin, freestanding HHAs, 2024 | 21.2% | MedPAC, March 2026 |
| FFS Medicare margin, 2001 (first PPS year) | 23% | MedPAC, March 2026 |
| Average FFS Medicare margin, 2001–2023 | 17.2% | MedPAC, March 2026 |
| FFS Medicare margin, 2019 | 15.4% | MedPAC, March 2026 |
| Projected FFS Medicare margin, 2026 | 19% | MedPAC, March 2026 |
| Cost growth per 30-day period, 2024 | +0.2% | MedPAC, March 2026 |
The through-line is stark: Medicare has paid home health well above cost every year since the prospective payment system began in 2000. That persistent gap is the entire basis for MedPAC's 2027 rate-cut recommendation.
Margin variation by agency type
Not every agency shares in the profitability. Ownership, scale, and setting produce a wide spread — and hospital-based agencies actually lose money on Medicare.
| Metric (2024 FFS Medicare margin) | Value | Source |
|---|---|---|
| For-profit freestanding HHAs | 23.1% | MedPAC, March 2026 |
| Nonprofit freestanding HHAs | 12.2% | MedPAC, March 2026 |
| Hospital-based HHAs | -15.2% | MedPAC, March 2026 |
| Largest-volume quintile | 23.2% | MedPAC, March 2026 |
| Smallest-volume quintile | 14.4% | MedPAC, March 2026 |
| 25th percentile agency | 5.7% | MedPAC, March 2026 |
| 75th percentile agency | 31.0% | MedPAC, March 2026 |
The 25-point gap between the 25th and 75th percentile agencies shows how much cost structure and case-mix accuracy matter. Two agencies of similar size can post radically different margins based on how efficiently they deliver care — and how precisely they capture it on the cost report. Sound bookkeeping and cost allocation throughout the year is what makes a defensible, margin-accurate filing possible.
5. Payment Rates, PDGM, and the 2026 Reimbursement Cuts
The Patient-Driven Groupings Model (PDGM) and a 30-day unit of payment reshaped home health reimbursement in 2020. The 2026 final rule is where the budget-neutrality reckoning from that transition finally landed on rates.
The CY 2026 final rule
For the first time in the PDGM era, agencies face a net payment reduction rather than a modest bump.
| Metric | Value | Source |
|---|---|---|
| Net change to home health payments, CY 2026 | -1.3% (-$220 million) | CMS-1828-F, November 2025 |
| Base payment update, CY 2026 | +2.4% (+$405 million) | CMS-1828-F, 2025 |
| Permanent behavioral adjustment, CY 2026 | -1.023% (-$150 million) | CMS-1828-F, 2025 |
| Temporary adjustment, CY 2026 | -3.0% (-$460 million) | CMS-1828-F, 2025 |
| Outlier (FDL) adjustment, CY 2026 | -0.1% (-$15 million) | CMS-1828-F, 2025 |
| PDGM payment groups | 432 | CMS-1828-F, 2025 |
| Case-mix weights recalibrated using | CY 2024 claims data | CMS-1828-F, 2025 |
Behavioral adjustments stacking up
CMS has clawed back "assumed vs. actual behavior" money every year since 2023, and identified billions more in temporary overpayments still to be recovered.
| Metric | Value | Source |
|---|---|---|
| Permanent reduction applied, CY 2023 | -3.925% | CMS-1828-F, 2025 |
| Permanent reduction applied, CY 2024 | -2.890% | CMS-1828-F, 2025 |
| Permanent reduction applied, CY 2025 | -1.975% | CMS-1828-F, 2025 |
| Temporary adjustment amount identified, CY 2020–2022 | $4.76 billion | CMS-1828-F, 2025 |
| MedPAC recommended base-rate cut for 2027 | -7% | MedPAC, March 2026 |
| Estimated 5-year federal savings from 2027 cut | $10–25 billion | MedPAC, March 2026 |
With margins still projected at 19% for 2026, MedPAC argues these cuts do not threaten access. For agencies, the message is that the cost report — and the cost efficiency it documents — is under more scrutiny than ever.
6. Costs, Visits, and the Home Health Workforce
Agencies have protected margins largely by delivering fewer visits per period while labor costs rise. The cost report is where that trade-off becomes visible.
Visit intensity is falling
| Metric | Value | Source |
|---|---|---|
| In-person visits per full 30-day period, 2024 | 8.4 | MedPAC, March 2026 |
| Same measure, 2019 | 10.2 (-18% by 2024) | MedPAC, March 2026 |
| Total in-person visits, 2024 | 65.4 million | MedPAC, March 2026 |
| Total in-person visits, 2019 | 99.7 million (-34.4% by 2024) | MedPAC, March 2026 |
| Therapy visits per full 30-day period, 2024 | 3.8 | MedPAC, March 2026 |
| Skilled nursing visits per full 30-day period, 2024 | 4.1 | MedPAC, March 2026 |
| 30-day periods including a telehealth visit or RPM, 2024 | 2.2% | MedPAC, March 2026 |
Workforce and labor cost pressure
Labor is the dominant cost line on any home health cost report, and the supply-demand imbalance in direct-care staffing continues to push wages.
| Metric | Value | Source |
|---|---|---|
| Home health & personal care aides employed, 2024 | 4,347,700 | BLS, OOH (2025) |
| Median annual wage, 2024 | $34,900 ($16.78/hr) | BLS, OOH (2025) |
| Median wage in home healthcare services industry, 2024 | $35,250 | BLS, OOH (2025) |
| Projected employment growth, 2024–2034 | +17% (much faster than average) | BLS, OOH (2025) |
| Projected new jobs, 2024–2034 | +739,800 | BLS, OOH (2025) |
| Projected annual openings | ~765,800 | BLS, OOH (2025) |
| U.S. home care providers market size, 2026 | $173.6 billion | IBISWorld (2026) |
Methodology and Sources
This roundup prioritizes primary, government, and official data sources. Agency-level financial figures (margins, costs, payment per period) originate from Medicare home health cost report files as analyzed by MedPAC; payment-policy figures come directly from CMS rulemaking; filing rules come from CMS regulations and the Medicare Administrative Contractor that implements them; workforce data comes from the Bureau of Labor Statistics. Where a figure reflects the most recent available data (for example, 2024 cost report data published in early 2026), the year is noted inline.
Sources used:
- Medicare Payment Advisory Commission (MedPAC), Report to the Congress: Medicare Payment Policy, Chapter 8: Home Health Care Services, March 2026 — medpac.gov
- Centers for Medicare & Medicaid Services (CMS), CY 2026 Home Health Prospective Payment System Final Rule (CMS-1828-F), November 28, 2025 — cms.gov
- CMS, Home Health Agency 1728-2020 Form and Cost Reports data — cms.gov
- CMS Provider Reimbursement Manual (PRM) Part I & 15-2, and 42 CFR 413.20 / 413.24
- Novitas Solutions (Medicare Administrative Contractor), Cost Report Filing Instructions — novitas-solutions.com
- CMS, National Health Expenditure Data / NHE Fact Sheet, 2024 — cms.gov
- U.S. Bureau of Labor Statistics, Occupational Outlook Handbook: Home Health and Personal Care Aides (May 2024 data) — bls.gov
- IBISWorld, Home Care Providers in the US (market size, 2026) — ibisworld.com
Last updated: July 2026. We update this page quarterly as new MedPAC reports, CMS rules, and cost report data are released.
Soriaga & Associates, LLC is a CPA firm with 25+ years of specialized experience in home health, hospice, and home care accounting and Medicare cost report preparation. If you have questions about your agency's cost report or margin position, schedule a free consultation.