
Free data · Home health
Home Health Cost Report Benchmarks
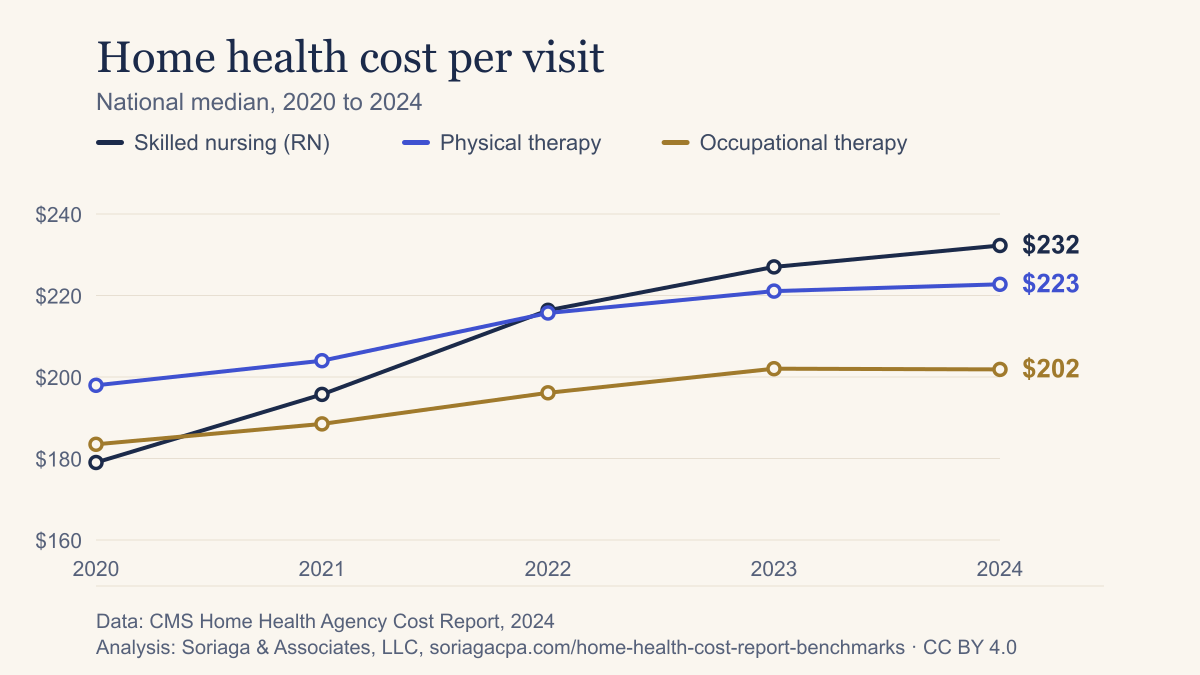
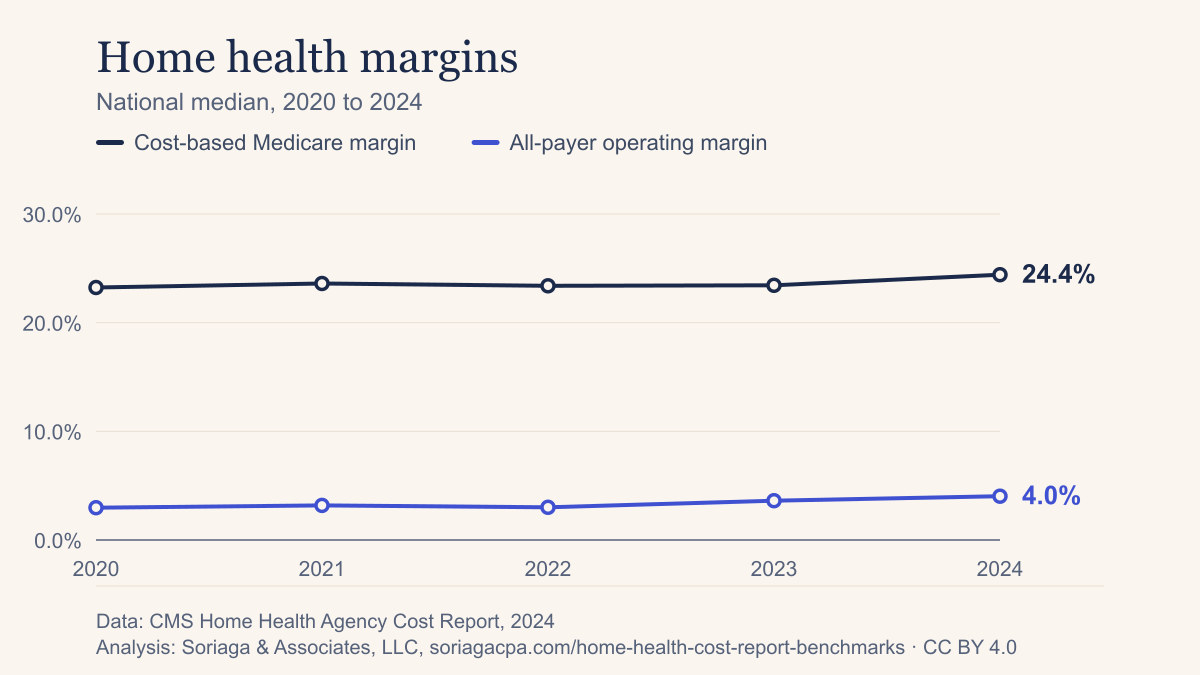
In 2024, the median Medicare-certified home health agency reported a cost of $232 per skilled nursing (RN) visit and $223 per physical therapy visit, based on 7,129 cost reports filed with CMS. The median all-payer operating margin was 4.0%, and the median cost-based Medicare margin was 24.4%.
Data year: 2024 (latest complete year) Updated October 22, 2026
Key findings, 2024
Home health benchmarks at a glance
$232
Median cost per visit, skilled nursing (RN)
Across 7,129 agencies that report RN visits. The middle half reported $170 to $324 a visit.
Source: CMS Home Health Agency Cost Report (data.cms.gov), 2024
$223
Median cost per visit, physical therapy
Occupational therapy had a median of $202 a visit. The middle half of agencies reported $171 to $301 for physical therapy.
Source: CMS Home Health Agency Cost Report (data.cms.gov), 2024
$92
Median cost per visit, home health aide
Medical social services had a median of $236 a visit, across 4,742 agencies that report it.
Source: CMS Home Health Agency Cost Report (data.cms.gov), 2024
4.0%
Median all-payer operating margin
Net patient revenue minus operating expenses, as a share of net patient revenue, across 6,735 agencies. It includes costs Medicare does not allow.
Source: CMS Home Health Agency Cost Report (data.cms.gov), 2024
24.4%
Median cost-based Medicare margin
This compares Medicare PPS payments to the Medicare-allowable program cost on the cost report. It is not the same as the all-payer margin.
Source: CMS Home Health Agency Cost Report (data.cms.gov), 2024
39.9%
Medicare share of all visits
Pooled across all agencies: total Medicare visits divided by total visits. The median agency was 61.4% Medicare.
Source: CMS Home Health Agency Cost Report (data.cms.gov), 2024
National, 2024
National home health benchmarks
Quartiles are across agencies. Share metrics also show a pooled value: total numerator divided by total denominator across all agencies, so large agencies count for more.
| Metric | Agencies (n) | 25th percentile | Median | 75th percentile | Pooled |
|---|---|---|---|---|---|
| Cost per visit, skilled nursing (RN) | 7,129 | $169.79 | $232.26 | $323.59 | n/a |
| Cost per visit, skilled nursing (LPN) | 5,463 | $91.81 | $130.38 | $190.00 | n/a |
| Cost per visit, physical therapy | 7,086 | $170.85 | $222.74 | $300.97 | n/a |
| Cost per visit, physical therapy assistant | 4,962 | $105.16 | $137.49 | $202.59 | n/a |
| Cost per visit, occupational therapy | 6,286 | $155.47 | $201.86 | $283.38 | n/a |
| Cost per visit, occupational therapy assistant | 3,481 | $99.39 | $136.20 | $205.58 | n/a |
| Cost per visit, speech-language pathology | 5,069 | $155.07 | $205.27 | $289.44 | n/a |
| Cost per visit, medical social service | 4,742 | $162.33 | $235.67 | $375.16 | n/a |
| Cost per visit, home health aide | 5,639 | $57.19 | $92.45 | $148.19 | n/a |
| Total visits per agency | 7,140 | 3,573 | 8,862 | 21,240 | n/a |
| Medicare share of visits | 7,286 | 36.5% | 61.4% | 100.0% | 39.9% |
| All-payer operating margin | 6,735 | -5.7% | 4.0% | 13.8% | n/a |
| Cost-based Medicare margin | 6,890 | 8.4% | 24.4% | 38.0% | n/a |
By state, 2024
Home health benchmarks by state
Pick a metric and sort by any column. States with fewer than 11 agencies for a metric are not shown.
Select a column heading to sort. Data year: 2024.
| Alabama | 101 | $146.94 | $189.20 | $219.67 |
|---|---|---|---|---|
| Alaska | 9 | Not shown (fewer than 11 agencies) | ||
| Arizona | 112 | $157.52 | $203.96 | $276.05 |
| Arkansas | 62 | $160.68 | $216.06 | $269.66 |
| California | 1,881 | $229.32 | $319.20 | $451.13 |
| Colorado | 75 | $155.22 | $218.28 | $285.68 |
| Connecticut | 48 | $152.59 | $198.59 | $251.67 |
| Delaware | 10 | Not shown (fewer than 11 agencies) | ||
| District of Columbia | 11 | $166.00 | $229.98 | $321.31 |
| Florida | 674 | $119.96 | $164.47 | $229.20 |
| Georgia | 79 | $209.00 | $238.67 | $284.80 |
| Hawaii | 7 | Not shown (fewer than 11 agencies) | ||
| Idaho | 37 | $150.89 | $193.05 | $284.96 |
| Illinois | 411 | $175.31 | $219.03 | $274.14 |
| Indiana | 109 | $157.97 | $214.83 | $274.21 |
| Iowa | 61 | $198.54 | $240.37 | $333.00 |
| Kansas | 61 | $147.31 | $188.13 | $277.51 |
| Kentucky | 69 | $168.68 | $203.18 | $271.58 |
| Louisiana | 149 | $151.73 | $183.34 | $225.75 |
| Maine | 17 | $260.74 | $291.88 | $319.46 |
| Maryland | 41 | $208.13 | $243.74 | $291.04 |
| Massachusetts | 86 | $139.17 | $228.78 | $280.10 |
| Michigan | 201 | $174.69 | $220.42 | $287.35 |
| Minnesota | 47 | $186.78 | $244.86 | $336.13 |
| Mississippi | 34 | $129.50 | $166.75 | $200.56 |
| Missouri | 83 | $186.79 | $232.44 | $310.41 |
| Montana | 12 | $220.46 | $316.40 | $369.17 |
| Nebraska | 29 | $221.44 | $252.29 | $321.60 |
| Nevada | 140 | $183.92 | $244.06 | $303.99 |
| New Hampshire | 21 | $234.87 | $270.55 | $305.14 |
| New Jersey | 29 | $219.47 | $239.73 | $294.38 |
| New Mexico | 51 | $139.99 | $209.45 | $296.96 |
| New York | 72 | $192.70 | $253.53 | $336.50 |
| North Carolina | 135 | $158.11 | $228.43 | $280.40 |
| North Dakota | 7 | Not shown (fewer than 11 agencies) | ||
| Ohio | 184 | $143.35 | $197.74 | $248.64 |
| Oklahoma | 175 | $186.36 | $235.58 | $310.52 |
| Oregon | 39 | $262.84 | $336.74 | $435.56 |
| Pennsylvania | 163 | $143.44 | $195.94 | $276.14 |
| Puerto Rico | 26 | $75.35 | $94.34 | $110.10 |
| Rhode Island | 18 | $132.23 | $192.40 | $225.62 |
| South Carolina | 58 | $188.85 | $213.81 | $245.92 |
| South Dakota | 14 | $209.10 | $227.73 | $281.56 |
| Tennessee | 95 | $157.42 | $201.02 | $226.72 |
| Texas | 996 | $159.13 | $220.09 | $295.75 |
| Utah | 60 | $124.97 | $176.26 | $230.82 |
| Vermont | 8 | Not shown (fewer than 11 agencies) | ||
| Virginia | 158 | $163.61 | $233.70 | $300.82 |
| Washington | 50 | $265.00 | $363.66 | $423.38 |
| West Virginia | 42 | $170.42 | $216.72 | $266.78 |
| Wisconsin | 46 | $179.28 | $213.66 | $283.62 |
| Wyoming | 20 | $149.27 | $194.34 | $221.18 |
Size and ownership, 2024
By agency size and ownership type
By agency size (total visits)
| Size band | Median: Cost per visit, skilled nursing (RN) | Median: All-payer operating margin | Median: Cost-based Medicare margin | Median: Total visits per agency | Agencies (n) |
|---|---|---|---|---|---|
| Under 5,000 | $290.68 | 2.7% | 17.8% | 2,465 | 2,385 |
| 5,000-19,999 | $222.65 | 3.4% | 23.8% | 10,174 | 2,833 |
| 20,000-49,999 | $205.28 | 6.6% | 31.7% | 29,719 | 1,256 |
| 50,000+ | $197.26 | 7.5% | 34.1% | 74,200 | 655 |
By ownership type
| Ownership | Median: Cost per visit, skilled nursing (RN) | Median: All-payer operating margin | Median: Cost-based Medicare margin | Median: Total visits per agency | Agencies (n) |
|---|---|---|---|---|---|
| For-profit | $227.85 | 4.7% | 25.8% | 8,116 | 6,400 |
| Nonprofit | $258.32 | -5.3% | 15.4% | 19,370 | 637 |
| Government | $278.04 | -30.8% | -7.9% | 6,405 | 91 |
| Other | Not shown (fewer than 11 agencies) | Not shown (fewer than 11 agencies) | Not shown (fewer than 11 agencies) | Not shown (fewer than 11 agencies) | 1 |
Trend
How the national median has moved
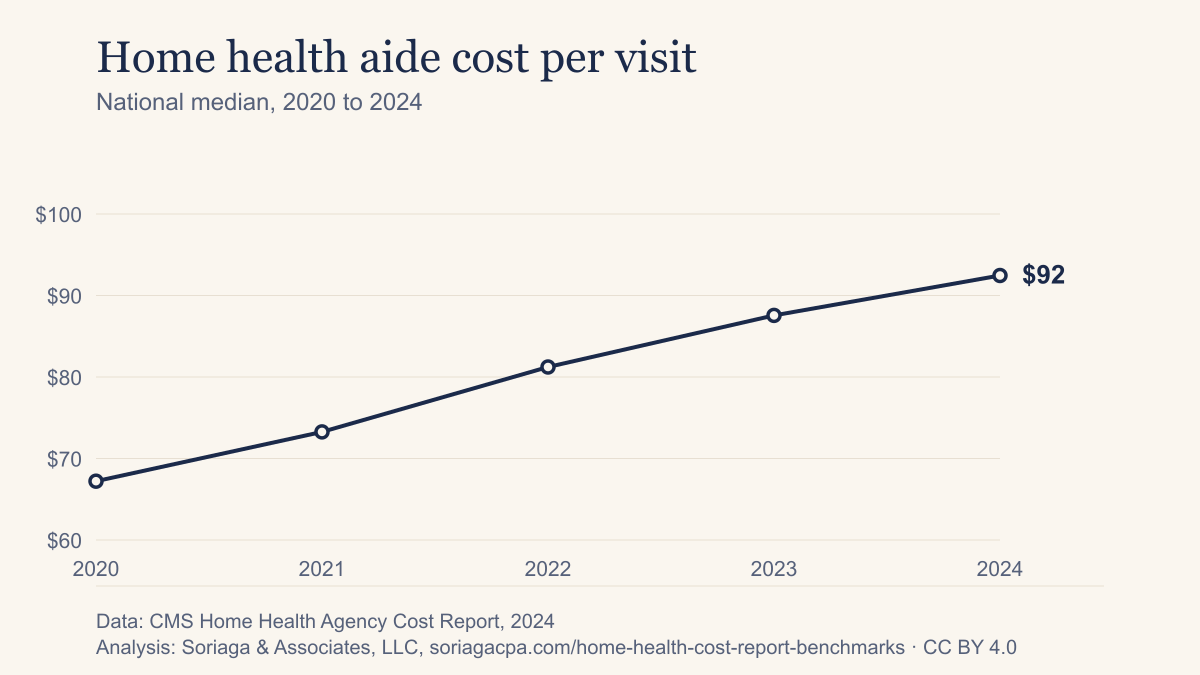
National medians by year, 2020 to 2024. Each chart can be embedded or downloaded, free with credit.
View the data table
| Year | Skilled nursing (RN) | Physical therapy | Occupational therapy |
|---|---|---|---|
| 2020 | $179 | $198 | $183 |
| 2021 | $196 | $204 | $189 |
| 2022 | $216 | $216 | $196 |
| 2023 | $227 | $221 | $202 |
| 2024 | $232 | $223 | $202 |
View the data table
| Year | Cost-based Medicare margin | All-payer operating margin |
|---|---|---|
| 2020 | 23.2% | 3.0% |
| 2021 | 23.6% | 3.2% |
| 2022 | 23.4% | 3.0% |
| 2023 | 23.4% | 3.6% |
| 2024 | 24.4% | 4.0% |
View the data table
| Year | Home health aide |
|---|---|
| 2020 | $67 |
| 2021 | $73 |
| 2022 | $81 |
| 2023 | $88 |
| 2024 | $92 |
Use it, with credit
Cite this data
Copy the credit line that fits where you are publishing. A link to this page is all we ask.
Credit line
Source: Soriaga & Associates, LLC, "Home Health Cost Report Benchmarks" (2024), https://www.soriagacpa.com/home-health-cost-report-benchmarks, based on CMS Home Health Agency Cost Report data. CC BY 4.0.
HTML link
<p>Source: <a href="https://www.soriagacpa.com/home-health-cost-report-benchmarks">Home Health Cost Report Benchmarks, Soriaga & Associates, LLC</a> (CMS data, 2024). CC BY 4.0.</p>
APA style
Soriaga & Associates, LLC. (2026). Home Health Cost Report Benchmarks: 2024 CMS data [Data set]. https://www.soriagacpa.com/home-health-cost-report-benchmarks
Open data
Download the data
CSV
All years, states, sizes and ownership types. Opens in Excel.
JSON
The same data with metric definitions, sources and counts.
GitHub
Methodology and code, open source.
Our tables, charts and text are licensed CC BY 4.0 with credit to Soriaga & Associates, LLC and a link to this page. The underlying CMS data is public domain.
Methodology
How we built these numbers
Source
We use the cost reports home health agencies file with CMS on Form CMS-1728-20, as cleaned and published by CMS on data.cms.gov in the Home Health Agency Cost Report. CMS source page
Year definition. CMS's data.cms.gov file year (2020 to 2024). Each yearly file holds cost reports whose periods mostly begin in that calendar year; it is not a uniform fiscal year.
Cleaning rules
- Start with 10,970 reports in the CMS file for 2024. Remove 3,497 with no financial data, costs or days.
- Remove 187 partial-year reports (a period under 300 or over 430 days), so partial years are not mixed with full years.
- Keep one report per provider per year (the longest period). 0 duplicates were dropped in 2024.
- Leave out the lowest and highest 1 percent of values for each metric (outliers), for that metric only. Share and provider-count metrics are not trimmed.
- Margins use only agencies with positive net patient revenue, and margins below −100% or above +100% are excluded as data errors.
- Suppress any cell with fewer than 11 agencies. No agency names, provider numbers or addresses are published.
Result for 2024: 7,286 cleaned cost reports.
Size bands and ownership
Size bands use total visits per agency: Under 5,000, 5,000-19,999, 20,000-49,999, 50,000+. Ownership is the type of control reported on the cost report: for-profit (proprietary), nonprofit and government, with a small remaining group shown as Other.
Metric definitions
Show all 13 metric definitions
- Cost per visit, skilled nursing (RN)
- Average cost per skilled nursing (RN) visit, only for agencies that report this discipline.
- Cost per visit, skilled nursing (LPN)
- Average cost per skilled nursing (LPN) visit, only for agencies that report this discipline.
- Cost per visit, physical therapy
- Average cost per physical therapy visit, only for agencies that report this discipline.
- Cost per visit, physical therapy assistant
- Average cost per physical therapy assistant visit, only for agencies that report this discipline.
- Cost per visit, occupational therapy
- Average cost per occupational therapy visit, only for agencies that report this discipline.
- Cost per visit, occupational therapy assistant
- Average cost per occupational therapy assistant visit, only for agencies that report this discipline.
- Cost per visit, speech-language pathology
- Average cost per speech-language pathology visit, only for agencies that report this discipline.
- Cost per visit, medical social service
- Average cost per medical social service visit, only for agencies that report this discipline.
- Cost per visit, home health aide
- Average cost per home health aide visit, only for agencies that report this discipline.
- Total visits per agency
- Total visits, all disciplines and payers.
- Medicare share of visits
- Each agency's Title XVIII (Medicare) visits divided by its total visits. Quartiles and mean are across agencies. The pooled value is total Medicare visits divided by total visits across all agencies in the group.
- All-payer operating margin
- (Net patient revenue minus total operating expenses) divided by net patient revenue. Only where net patient revenue is above zero; margins outside -100% to +100% are excluded as data errors.
- Cost-based Medicare margin
- (Medicare PPS payments minus total HHA Medicare program cost) divided by Medicare PPS payments. Payments are the sum of the four 'Total PPS Payment' episode columns and the two 'Total PPS Outlier Payment' columns (Wkst D lines 10 to 15), not adjusted for bad debts or sequestration. Margins outside -100% to +100% are excluded as data errors.
Read before you use it
Limitations
- Cost reports are provider-filed and may be unaudited.
- The data mixes reports at different CMS statuses (as submitted, settled, reopened) because CMS keeps the highest status per report.
- All-payer operating margins include costs that Medicare does not allow.
- Partial-year reports (period under 300 or over 430 days) are excluded.
- The newest year is incomplete and fills in over time, so headline figures use the latest complete year.
- Figures are not risk-adjusted or wage-adjusted.
- Cells with fewer than 11 agencies are suppressed. No provider-level data is published.
- About a third of rows in the CMS files have no financial data (blank Total Cost) and are excluded.
- Medicare PPS payments are the four 'Total PPS Payment' episode columns plus the two 'Total PPS Outlier Payment' columns (Wkst D lines 10 to 15; PRM 15-2 section 4715.2).
- Share metrics have a pooled value (total numerator over total denominator); per-agency medians can hide small levels of care.
General information from public CMS filings, not an audit, a valuation or advice for your agency.
Not affiliated with or endorsed by CMS or HHS.
Where the data comes from
Sources
- data.cms.gov Home Health Agency Cost Report, file year 2020 (CSV) (CMS last updated 2026-09-30)
- data.cms.gov Home Health Agency Cost Report, file year 2021 (CSV) (CMS last updated 2026-10-05)
- data.cms.gov Home Health Agency Cost Report, file year 2022 (CSV) (CMS last updated 2026-10-05)
- data.cms.gov Home Health Agency Cost Report, file year 2023 (CSV) (CMS last updated 2026-10-05)
- data.cms.gov Home Health Agency Cost Report, file year 2024 (CSV) (CMS last updated 2026-09-30)
- data.cms.gov Home Health Agency Cost Report (landing page)
- data.cms.gov Home Health Agency Cost Report data dictionary
- data.cms.gov Home Health Agency Cost Report methodology
FAQ
Home health cost report benchmark questions, answered
Want these medians applied to your own agency? Book a free review.
What is the average cost per visit for home health?
In 2024, the median cost per skilled nursing (RN) visit was $232.26, physical therapy $222.74, occupational therapy $201.86, and home health aide $92.45. These are medians across agencies, not visit-weighted averages.
What does a home health aide visit cost an agency?
In 2024, the median cost per home health aide visit was $92.45, based on 5,639 agencies that report aide visits. Medical social services had a median of $235.67.
What is the typical home health operating margin?
In 2024, the median all-payer operating margin was 4.0% across 6,735 agencies. It includes costs Medicare does not allow.
What is the cost-based Medicare margin for home health?
In 2024, the median cost-based Medicare margin was 24.4%. It compares Medicare PPS payments to the Medicare-allowable program cost on the cost report, so it differs from the all-payer margin and from MedPAC's published margin.
How much of home health volume is Medicare?
In 2024, Medicare was 39.9% of all visits, pooled across 7,286 agencies. The median agency was 61.4% Medicare.
Where does this data come from?
It comes from the cost reports home health agencies file with CMS (Form CMS-1728-20), published by CMS on data.cms.gov as the Home Health Agency Cost Report. We clean the CMS files with documented rules and publish only aggregates. No agency names, provider numbers or addresses appear.
How current is this data?
The latest complete year is 2024, with 7,286 cleaned cost reports. CMS's data.cms.gov file year (2020 to 2024). Each yearly file holds cost reports whose periods mostly begin in that calendar year; it is not a uniform fiscal year. The tables were last built on October 22, 2026. We update them when CMS adds a new year of data.
Can I use these numbers?
Yes. Our tables, charts and text are licensed CC BY 4.0 (https://creativecommons.org/licenses/by/4.0/). Please credit Soriaga & Associates, LLC and link to https://www.soriagacpa.com/home-health-cost-report-benchmarks. The underlying CMS data is public domain. The "Cite this data" box on this page has a credit line, an HTML link and an APA citation you can copy.
How does my agency compare?
Book a free review at https://www.soriagacpa.com/book-online. We compare your cost report or your books with these medians, by state and size, and explain what the gaps may mean. The numbers here are medians of home health agency filings, not a target for any one agency.
Are cost reports audited?
Not always. Cost reports are provider-filed and may be unaudited. The data also mixes reports at different CMS statuses (as submitted, settled and reopened), because CMS keeps the highest status for each report. Treat the figures as general information from public filings.
Why are some states not shown?
Any state or group with fewer than 11 agencies for a metric is suppressed and shown as "Not shown (fewer than 11 agencies)". That protects small groups, and no provider-level data is published.
Free 20-minute call
See how your agency compares with these medians.
Talk directly with Christian Soriaga, CPA. No pitch deck, no obligation.
On the call we’ll cover
- Your situation and what is due next
- Deadlines and filing status
- A clear written fee quote
- Clear next steps, no obligation

Christian Soriaga, CPA
Soriaga & Associates, LLC